We Made AI Status Embeddable: One Line of HTML, Live on Any Site
Every team building on AI depends on APIs it does not control. Claude, GPT, Gemini, Mistral, the gateways in front of them. When one of those degrades, the blast radius is everyone downstream, and the first thing a developer wants is a single honest answer to a single question: is it them, or is it me. We just made that answer embeddable.
The TensorFeed Live Monitor is a free, self-contained widget. One line of HTML drops a real-time status console for every major AI provider onto any site. It is the same live data behind our status dashboard, surfaced for your pages instead of ours. Showcase, live preview, and the copy-paste snippet are at tensorfeed.ai/embed.
A status widget that lies is worse than no widget
The entire value of this thing is trust. The moment it shows a green provider as red, or invents a number it does not have, it is a liability on whatever site embedded it. So we built it honest by construction, and that constraint drove most of the engineering.
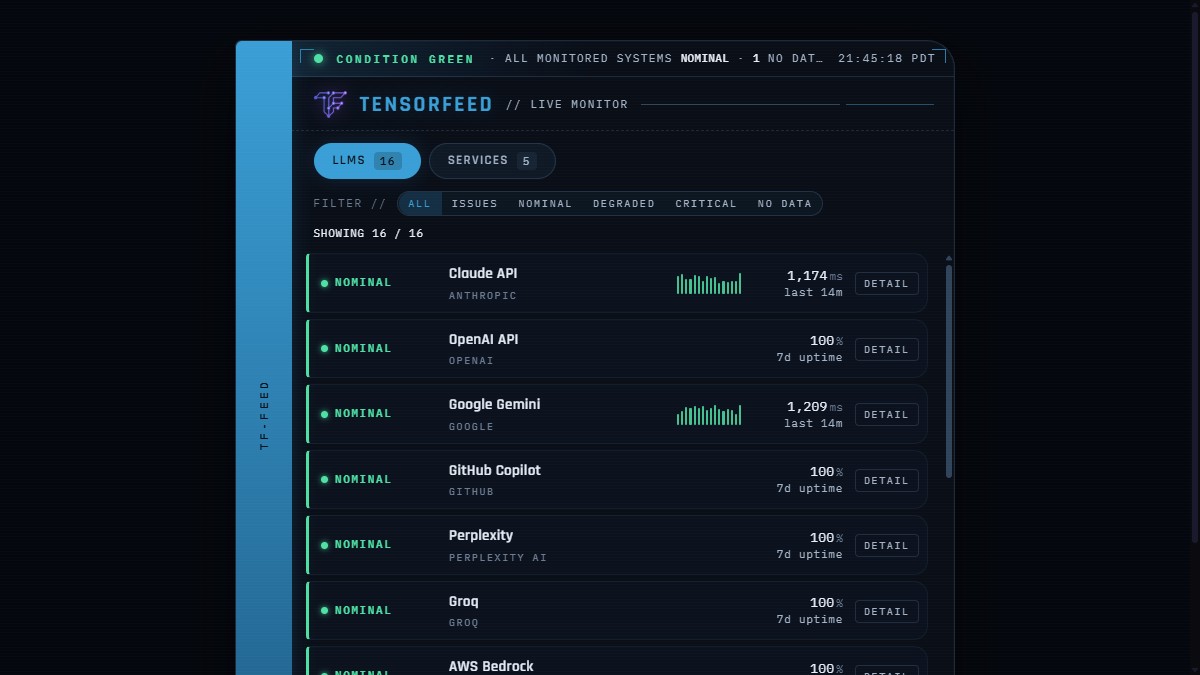
Vendor status is authoritative. We measure p95 latency for the providers we actively probe, and for those we show the real number. For the providers we do not latency-probe, we do not draw a fake chart and we do not print a placeholder that looks broken. We show their real seven-day uptime percentage, computed from minute-resolution polling, because that is a true number we actually have. Every row carries real data or it carries nothing, never something that looks like data and is not.
The hardest call was the cry-wolf trap. Our own synthetic probe will sometimes report a provider as failing when the real cause is our probe key hitting a quota, not the provider being down. A public widget that tells the world a healthy provider is critical because of our internal limits would destroy the credibility that makes it worth embedding. So the probe never overrides vendor status. A provider with no status source is labeled NO DATA, shown in grey, and explicitly not counted as an outage. Condition Green never sits next to an implied failure. The dramatic red alert chrome is real and it fires, but only when something is actually down.
Why a widget, and why free
Distribution for an agent-first product is not banner ads. It is being the surface other people choose to put on their own site, and being the source an agent cites when asked. Every embed is three things at once: a backlink, a brand impression, and a machine-readable pointer back to the canonical feeds, on a site we do not own and did not have to pay for. The Detail control on every row deep-links to the per-provider page on TensorFeed. The discovery loop closes itself, for humans and for agents, and it compounds.
It is free and it will stay free, with no ads. That is not generosity, it is the business model being coherent. Our revenue is premium data for agents, not attention arbitrage. An ad on a trust widget erodes the exact credibility that makes the widget spread. If this ever does numbers that make an ad conversation tempting, the right answer will still be no, because the asset is the trust.
Three ways to embed it
One line of HTML, anywhere:
<iframe src="https://tensorfeed.ai/widget/status"
        title="TensorFeed live AI status" width="100%" height="600"
        loading="lazy" style="border:0;max-width:720px"></iframe>
A zero-dependency component for anything with a build step. It is a framework-agnostic web component plus a helper for React, MIT licensed, SSR-safe:
npm install @tensorfeed/status-widget

import '@tensorfeed/status-widget';
<tensorfeed-status accent="blue" poll="30"></tensorfeed-status>
And a browser extension: the same live console in a toolbar popup, with a badge that quietly turns amber or red the moment a provider degrades, so you see AI health without opening anything. It is live on the Chrome Web Store; Firefox build is next. Full write-up here.
Default look is a light-blue bridge spine with green status indicators, which keeps the contrast legible at a glance. Add ?accent=auto to make the whole console go green when every system is nominal, or ?accent=green to force it. Add ?poll=60 to slow the refresh on a low-traffic page. No API key, no tracking, no host-page CSS dependency. It cannot break your site and your site cannot break it.
Where this goes
It already covers sixteen LLM providers and a set of services, and it grows itself: when we add a provider to monitoring, it appears in every embed automatically, with no redeploy on anyone's part. The next layer is sharper detection, teaching the probe to tell our own infrastructure limits apart from a real provider failure, so the widget can flag a degradation before the vendor status page admits it. That is the difference between a status mirror and an early-warning system, and it is the direction.
For now: it is live, it is honest, it is free, and it is one line of HTML. Drop it on your status page, your docs, your internal dashboard, or your portfolio. Preview every option and grab the snippet at tensorfeed.ai/embed. If you are building agents, the same truth is one fetch away at the developer API.